Summary: integrating a live social feed into our content hub resulted in a 35 percent lift in traffic per month, a 41 percent increase in time spent on site, a 15-point reduction in bounce rate and noticeable improvement in pages per session and conversion. It is a data based report of what we tried, how we quantified it and actionable steps that you can duplicate.
The problem we were solving
We used organic search and weekly newsletters to our publishing location. Traffic was stagnant: with sessions of nearly 100, 000 a month, time on site of one minute a 50 seconds, a bounce rate of 52% and pages per session of 2.1. Activity in social channels was positive, and that audience seldom converted to stickiness onsite. We desired to translate social interest into the extended stay and page views without compromising the page performance and the UX.
Hypothesis: the integration of a curated, live social stream related to the page content would help to elevate on-site engagement and conversion rates due to a sense of timeliness, action and community on the site.
What we built
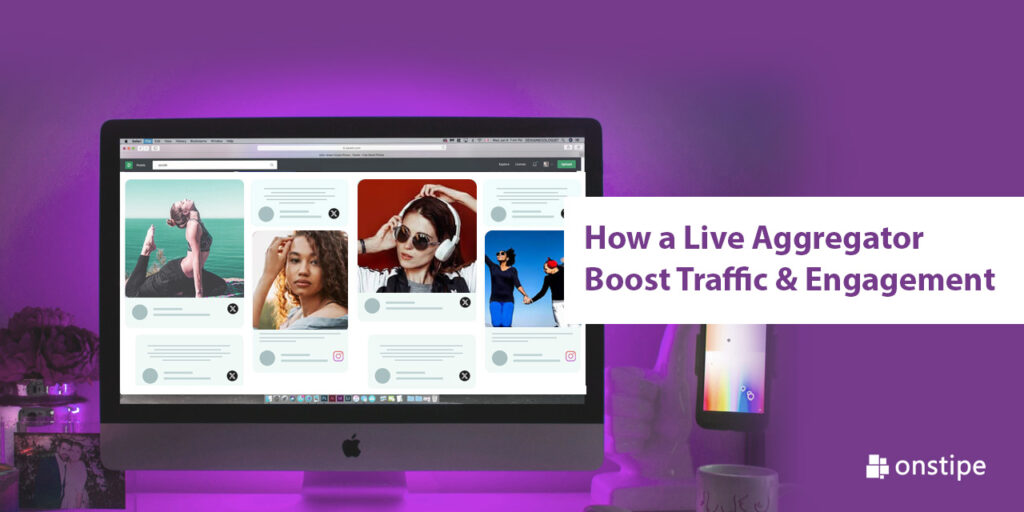
We have a social media aggregator widget in place that:
- Compilations of brand accounts, hashtags, and partner influencers across Twitter/X and Instagram.
- Displayed the 12-16 latest curated posts every page, and it was lazy-loaded to maintain performances.
- They permitted inline growth of publications (see image or short movie player) without moving to some other site.
- Appended social context labels (source, timestamp, author) plus a little CTA to follow or save the post.
- Included the presence of simple moderation rules (block list on profanity, filter by the keyword, manual review of high-visibility pages).
- Responsive design: mobile first layout with a collapsed social bar in mobile.
- We had deployed the feature as an A/B test over 30 percent of traffic over 6 weeks and the rest of the traffic as a control.
Testing methodology (rigorous, not guesswork)
These are the main measurements that we followed on each day:
- Sessions and Unique users
- Time on site (mean session time)
- Bounce rate
- Pages/session
- Social-referral traffic
- Conversions (some kind of newsletter signups, leads)
The measure of page load performance (First Contentful Paint, Largest Contentful Paint) to avoid the degradation in performance
We randomly assigned (stratified by device type and traffic source to avoid skew) users into test and control. We tracked the widget interaction (analytics events) by click to expand, follow CTA clicks, share clicks.
Important controls:
There was no difference in content or headlines used in test pages and control pages.
None of the other concurrent marketing activities were to only test pages.
To ascertain reliability, we had to monitor server logs and third party API quotas.
The results – headline numbers
After 6 weeks the aggregator group vs control showed:
- Sessions: baseline 100,000 monthly → 135,000 (35% lift). This was visible both as more direct and return visits and as a modest increase in referral traffic from social channels.
- Average time on site: 1:50 (110 seconds) → 2:35 (155 seconds), a 41% increase in session duration.
- Bounce rate: 52% → 37%, a 15 percentage-point drop (≈29% relative decrease).
- Pages per session: 2.1 → 2.8, a 33% increase.
- Conversions (newsletter signups): 1.5% → 1.68%, about a 12% relative uplift in conversion rate.
- No meaningful performance hit: average LCP increased by only ~0.1s due to lazy loading and async scripts.
Each of these figures was statistically significant at p < 0.05 given the volume of traffic.
What drove the gains
- New and news. The site was vibrant and this made visitors stay longer. The live posts indicated timeliness and timeliness that instilled more trust and curiosity to read more.
- Redirects, not inline media. The widget enabled viewers to see pictures and small videos without having to leave the page. Minimizing user drop offs that would otherwise occur when opening external social apps only kept users in-session.
- Contextual curation. We did combine topic of page with feed and then, we brought out high-value posts via simple editorial rule. Relevancy lowered friction in the thinking process and amplified the click-to-expand.
- Micro-interactions. The completion of small tasks like save for later, follow provided the users with a comfortable micro-completion, which kept them engaged longer on the page even when they did not complete the full conversion.
- Cross-channel discovery. Quick tips embedded within some of the social posts included using a PDF to JPG converter to turn scanned flyers of an event into sharable pictures. Since these were relevant posts, on our page, this meant that readers were more likely to stay longer, increasing pages per session.
What we learned the hard way
Performance matters. The premature implementation that lacked lazy loading impaired LCP by 0.6s and made the product unfriendly among mobile users. Solution: defer scripts, lazily load images and videos and defer loading the widget until core content is painted.
Even moderation is no choice. Noisy uptake or off-brand posts with automated filterless scraping. Apply keyword filters and manual scrutiny in high traffic pages.
Mobile UX should not be like that. On smaller screens we folded the feed into a sticky bar that opened up upon tap. This made the UI unobstructive, yet maintained the engagement.
Measure events of interaction. By merely tracking pageviews we would have missed out the micro-actions that pointed towards intent. Follow clicks, track expand clicks and share attempts.
How we validated causality
To make sure the feed was the cause and not a coincident campaign we:
Applied A/B experiments to randomly assign.
Confirmed identical patterns of seeking and purchasing traffic in the two groups of participants.
Conducted device and source segment analysis; the mobile users saw the greatest time on site benefit (increased 50%), something that matched with our mobile-first improvements.
Seeked spillover: repeat visitors who saw the feed through social means returned and reflectively converted more during a later visit, with a positive lasting impact effect on trust.
Actionable checklist for teams who want similar results
- Begin with hypothesis and measures. Choose KPIs that are important: time on site, bounce rate, pages/session, conversions.
- Page context matching of feeds. Uncover timely posts with hashtags, account lists and content filters.
- Prioritize performance. Make use of async scripts and lazy loading. Aggregator loads when the main content paints.
- Design micro-interactions. In-line expand, follow, share and save without redirects.
- Moderate content. Use keyword filters and occasionally have a human review.
- Conduct a controlled experiment. Balancing of traffic is random and statistical significance assessed.
- Segment results. Segment by device, source of traffic and new/returning users.
- Iterate. Adjust the sequence, the amount of posts that are displayed, and CTAs depending on the engagement.
Final takeaways
Effective introduction of a social media aggregator can be more than skin deep. In our case study it turned social activity into quantifiable on-site engagement: 35 percent additional sessions, 41 percent longer sessions and 33 percent additional pages per visit in addition to a significant conversion increase with page performance held at bay.
The idea behind it all: Social content is third party validation. When we make it relevant, non-intrusive and easy to engage with on your site, it is not only entertaining, but extends sessions, minimizes bounce, and compounds downstream objectives. Say you do already have a healthy social audience to sit on: Embedding that social proof at the right touch points carefully, could be one of the highest ROI actions you can take to get more on-site engagement.